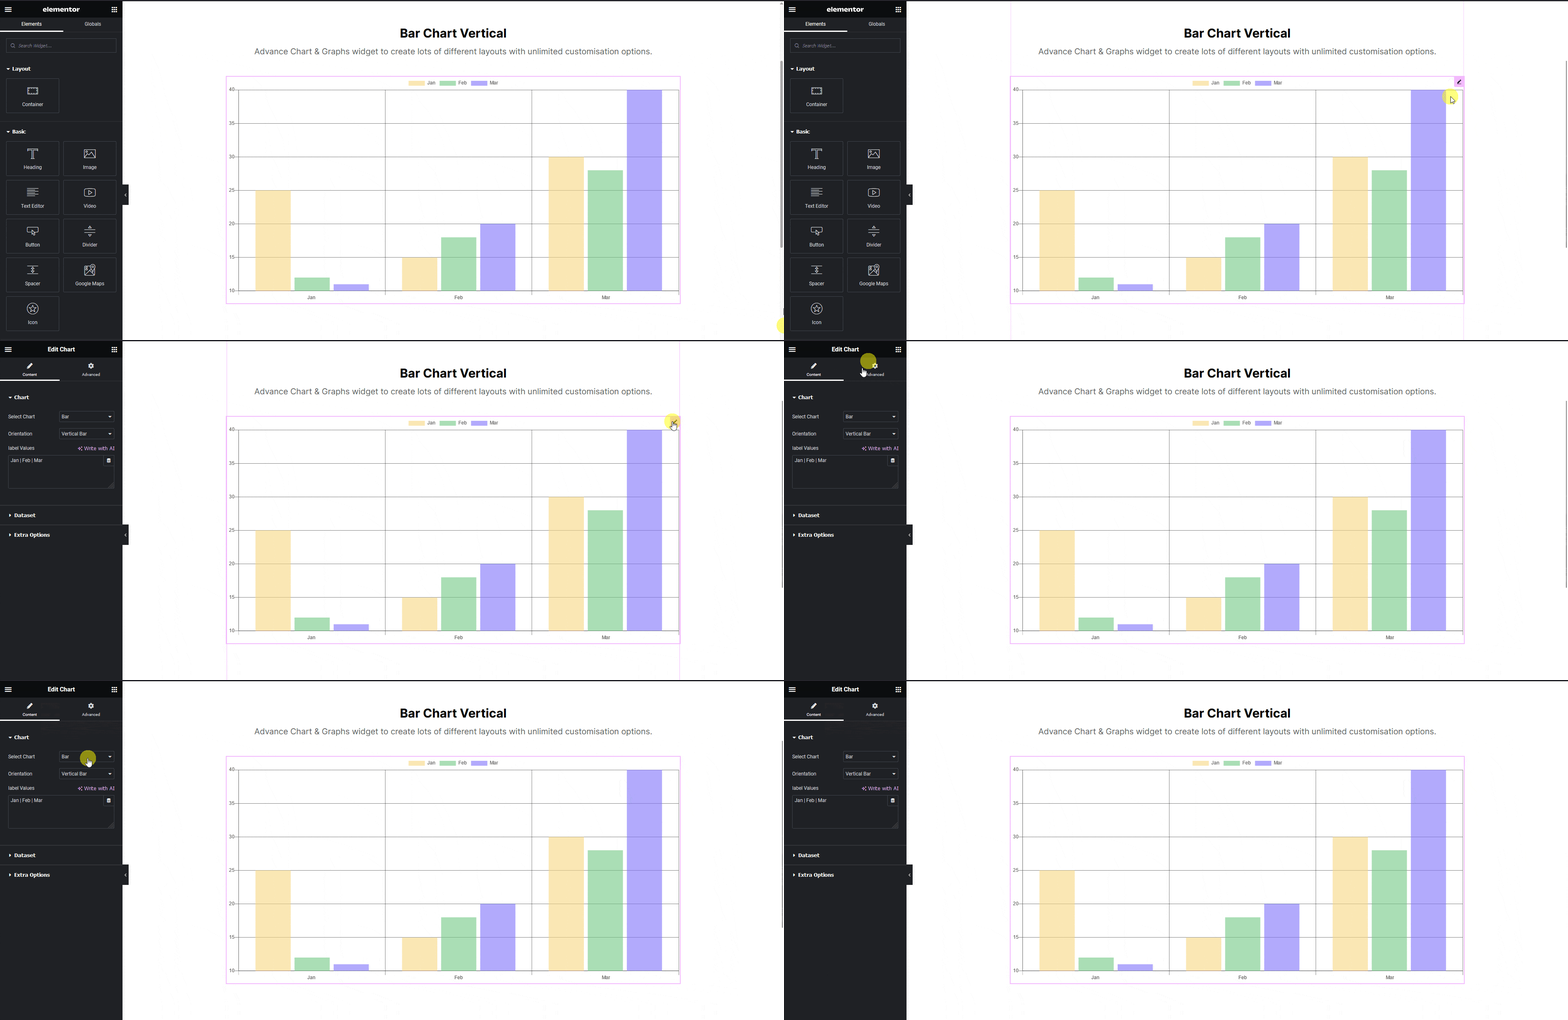
If you are using any charts (bar chart, pie chart etc.) in your Figma design to show some statistics, then you can tag those elements as a Chart widget from The Plus Addons for Elementor using the UiChemy plugin.
So when you export the design as an Elementor template, that particular section will use the Chart widget.
What Can be Tagged?
A frame can be tagged as a Chart widget.
How to Tag?
To do this, you can choose between two options: Step by Step Method or Express Conversion.
Here, we’ll go with the Step by Step Method.
- First, select the Step by Step Method and click on the Start button.
- Select the top-level page or frame of your layout, then click on the Next button.
- Under the Widget Tagging Mode tab, select the Manual Widget Tagging Option.
- Next, under the Manage Auto Layout tab, you’ll see two options: It’s already in Auto Layout and Convert to Auto Layout. We’ll go with the first option.
- After that, under the Tag Widgets tab, choose the frame or container that contains your element (Widget). Then, search for the Chart widget from The Plus Widgets in the UiChemy panel and select it. Here, you’ll see all the supported Elementor widgets.
On the next screen, you’ll get the information of which element you are tagging as what widget.
Then you’ll see widget specific tagging options.
- From the Chart Type dropdown, you have to select the chart type.
- Once done, click the Save button to complete the tagging, and you’ll see a Tagged successfully message.
Now if you export the design, that element will use the Chart widget from The Plus Addons for Elementor.

Note: Since this is a pro widget make sure The Plus Addons for Elementor free and pro plugins are installed and activated and the widget is activated as well. You might have to make some minor adjustments in the widget settings to match the design, especially those elements that are not tagged.
